

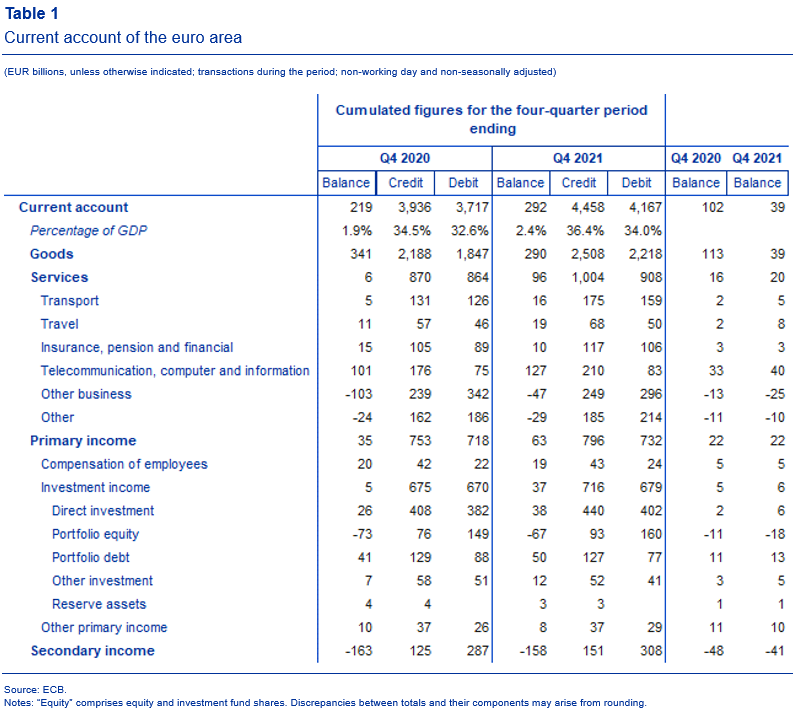
- Ìýsurplus at €292 billion (2.4% of euro area GDP) in 2021, up from €219 billion (1.9% of GDP) in 2020
- : largest bilateral current account surpluses vis-à -visÌýUnited KingdomÌý(€172 billion) andÌý³§·É¾±³Ù³ú±ð°ù±ô²¹²Ô»åÌý(€77 billion),Ìýlargest deficitÌývis-à -visÌýChinaÌý(€83 billion)
- Ìýshowed net liabilities of €180 billion (1.5% of euro area GDP)Ìýat end of 2021
Current account
°Õ³ó±ðÌýcurrent accountÌýsurplus of theeuro area increased to €292 billion (2.4% of euro area GDP) in 2021, up from €219 billion (1.9% of GDP) in 2020 (TableÌý1). This increase mainly reflected larger surpluses forÌýservicesÌý(up from €6 billion to €96Ìýbillion) andÌýprimary incomeÌý(up from €35Ìýbillion to €63Ìýbillion) and, to a lesser extent, a reduction in the deficit forÌýsecondary incomeÌý(down from €163 billion to €158Ìýbillion). These developments were partly offset by a decline in the surplus forÌýgoodsÌý(down from €341Ìýbillion to €290Ìýbillion).
The increase in the surplus forÌýservicesÌýin 2021 was due to larger surpluses forÌýtelecommunication, computer and information servicesÌý(up from €101 billion to €127Ìýbillion),Ìýtransport ²õ±ð°ù±¹¾±³¦±ð²õÌý(up from €5 billion to €16 billion) andÌýtravel ²õ±ð°ù±¹¾±³¦±ð²õÌý(up from €11 billion to €19 billion) as well as due to a reduction in the deficit forÌýother business ²õ±ð°ù±¹¾±³¦±ð²õÌý(down from €103 billion to €47 billion). Conversely, a lower surplus was recorded forÌýinsurance, pension and financial servicesÌý(down from €15 billion to €10 billion) and the deficit forÌýother servicesÌýincreased (up from €24Ìýbillion to €29 billion).
The increase in theÌýprimary incomeÌýsurplus in 2021 was driven by a larger surplus forÌýinvestment incomeÌý(up from €5 billion to €37 billion). This reflected larger surpluses forÌýdirect investment ¾±²Ô³¦´Ç³¾±ðÌý(up from €26Ìýbillion to €38 billion),Ìýportfolio debt ¾±²Ô³¦´Ç³¾±ðÌý(up from €41Ìýbillion to €50 billion) andÌýother investmentÌý¾±²Ô³¦´Ç³¾±ðÌý(up from €7 billion to €12 billion). Moreover, a smaller deficit was recorded forÌýportfolio equityÌý(down from €73 billion to €67 billion).
Data on the geographic counterparts of the euro area current account (Chart 1) show that in 2021 the euro area recorded its largest bilateral surpluses vis-à -vis theÌýUnited KingdomÌý(€172 billion, up from €147 billion in 2020),ÌýSwitzerlandÌý(€77 billion, up from €58Ìýbillion) and theÌýUnited StatesÌý(€56 billion, down from €74 billion). It also recorded a current account surplus vis-à -vis a residual group ofÌýother countriesÌý(€129 billion, down from €186 billion). The largest bilateral deficits were recorded vis-à -visÌýChinaÌý(€83 billion, up from €80 billion),ÌýEU Member States and EU institutions outside the euro areaÌý(€30 billion, down from €51 billion) andÌýoffshore centresÌý(€27Ìýbillion, down from €108 billion).
The most significant geographic changes in 2021 relative to 2020 in the components of the current account were as follows. ±õ²ÔÌýgoodsÌýthe deficit vis-à -vis China increased from €93 billion to €112 billion, while larger surpluses were recorded vis-à -vis theÌýUnited StatesÌý(up from €163 billion to €182 billion) and theÌýEU Member States and EU institutions outside the euro areaÌý(up from €40 billion to €61 billion). Moreover, theÌýgoodsÌýbalance vis-à -vis the residual group ofÌýother countriesÌýturned from a surplus of €83 billion to a deficit of €1 billion. ±õ²ÔÌý²õ±ð°ù±¹¾±³¦±ð²õÌýthe deficit vis-à -visÌýoffshore centresÌýdeclined strongly (down from €90 billion to €27 billion), while the surplus vis-à -vis the residual group ofÌýother countriesÌýincreased from €76 billion to €99 billion. ±õ²ÔÌýprimary ¾±²Ô³¦´Ç³¾±ðÌýa larger deficit was recorded vis-à -vis theÌýUnited StatesÌý(up from €7 billion to €36 billion), while the surpluses widened vis-à -vis the United Kingdom (up from €14 billion to €30 billion) and Switzerland (up from €9 billion to €24 billion). ±õ²ÔÌýsecondary incomeÌýthe deficit vis-à -vis theÌýEU Member States and EU institutions outside the euro areaÌýdecreased slightly from €96 billion to €90 billion.

International investment position
At the end ofÌýthe fourth quarter of 2021Ìýthe international investment position of the euro area recorded net liabilities of €180 billion vis-à -vis the rest of the world (1.5% of euro area GDP), down from €272 billion in the previous quarter (ChartÌý2 and TableÌý2).
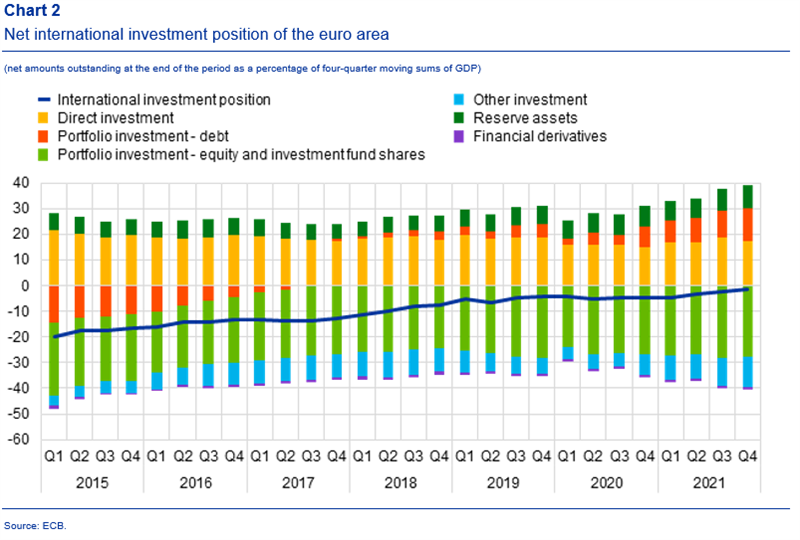
The decline in net liabilities of €92 billion reflected large but partly offsetting changes in the various investment components. Larger net assets were recorded forÌýportfolio debtÌý(up from €1.3 trillion to €1.6 trillion), while net liabilities remained stable inÌýportfolio equityÌý(€3.4 trillion). Conversely, net assets inÌýdirect investmentÌýdeclined (down from €2.3 trillion to €2.2 trillion), while net liabilities increased inÌýother investmentÌý(up from €1.3 trillion to €1.5 trillion).
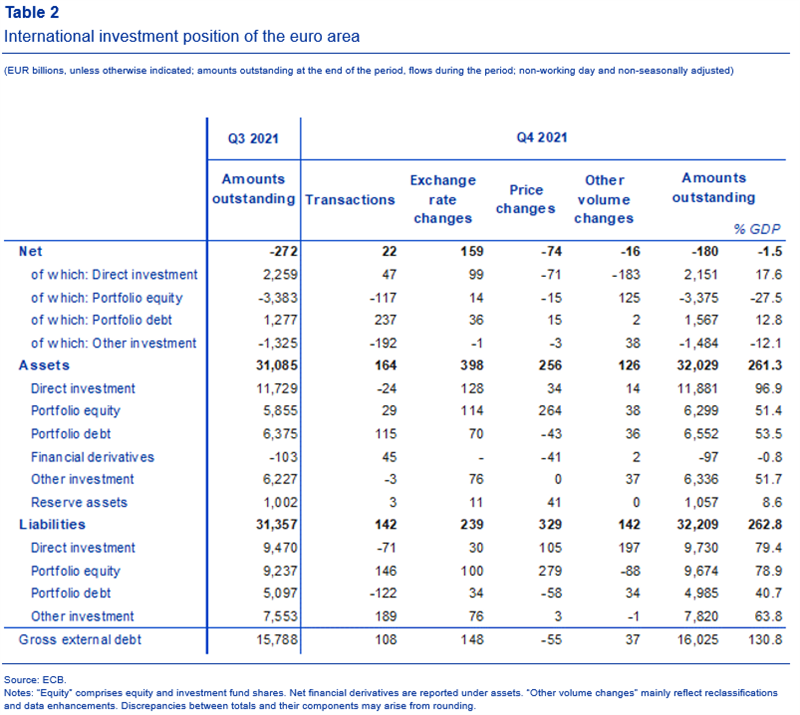
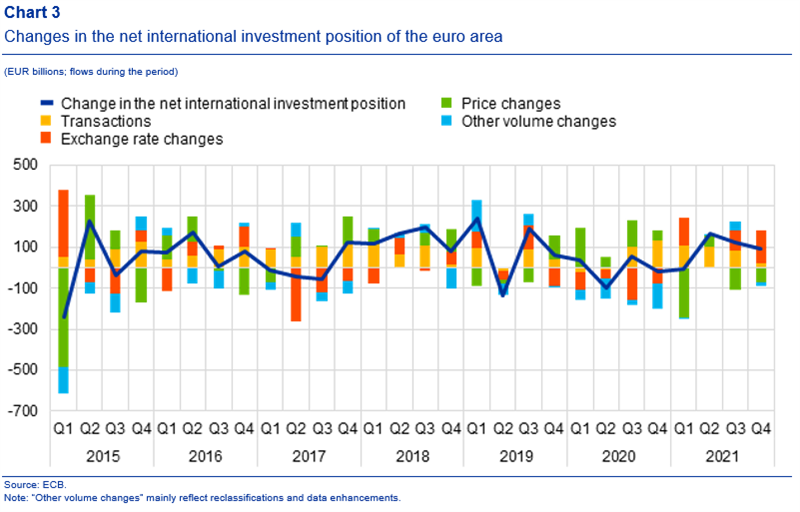
The developments in the euro area’s net international investment position in the fourth quarter of 2021 were mainly driven by positive net flows owing to exchange rate changes and, to a lesser extent, transactions, which were partly offset by negative net price changes and other volume changes (Table 2 and Chart 3).
Theincrease in net assets forÌýportfolio debtÌýwas mainly driven by positive net flows for transactions and exchange rate changes (Table 2). The decline in net assets forÌýdirect investmentÌýresulted from negative net flows in other volume changes (mostly reclassifications) and price changes. The stability in net liabilities forÌýportfolio equityÌýwas mainly due to positive net flows in other volume changes (mostly reclassifications) that were largely offset by negative net transactions. Larger net liabilities forÌýother investmentÌýwere driven by negative net transactions.
At the end of the fourth quarter of 2021 theÌýgross external debtÌýof the euro area amounted to €16.0Ìýtrillion (around 131% of euro area GDP), up by €237 billion compared with the previous quarter.
At the end of 2021 the stock of euro areaÌýdirect investment assetsÌýwas €11.9 trillion, 25% of which was invested in theÌýUnited StatesÌýand 21% in theÌýUnited KingdomÌý(see Table 3). The stock ofÌýforeign direct investment liabilitiesÌýwas €9.7 trillion, with 31% being investments originating from theÌýUnited States,Ìý19% from theÌýUnited KingdomÌýand 18% fromÌýoffshore centres.
±õ²ÔÌýportfolio investment, euro area holdings of foreign securities amounted to €6.3 trillion in equity and €6.6 trillion in debt at the end of 2021. The largest holdings of equity securities by the euro area were in securities issued by residents of theÌýUnited StatesÌý(accounting for 52%), followed by those issued by residents of theÌýUnited KingdomÌý²¹²Ô»åÌýoffshore centresÌý(each accounting for 9%). For debt securities, the largest euro area holdings were in securities issued by residents of theÌýUnited StatesÌý(accounting for 35%), theÌýUnited KingdomÌý(21%) and theÌýEU Member States and EU institutions outside the euro areaÌý(14%).
On theÌýportfolio investmentÌýliabilities side, non-residents’ holdings of securities issued by euro area residents stood at €9.7 trillion in equity and at €5.0 trillion in debt at the end of 2021. The largest holder countries of euro area equity securities were theÌýUnited StatesÌý(42%) and theÌýUnited KingdomÌý(11%), while for euro area debt securities the largest holders were theÌýBRICÌýgroup of countriesÌý(18%), theÌýUnited StatesÌý(15%) andÌýJapanÌý(13%).
±õ²ÔÌýother investment, euro area residents’ claims on non-residents amounted to €6.3 trillion, 31% of which was vis-à -vis theÌýUnited KingdomÌýand 23% vis-à -vis theÌýUnited States. Euro areaÌýother investmentÌýliabilities amounted to €7.8 trillion, with theÌýUnited KingdomÌýaccounting for 30%, while the shares of theÌýEU Member States and EU institutions outside the euro areaÌýand theÌýUnited StatesÌýwere 19% and 15% respectively.

ecb.europa.eu


