

- Ìýsurplus at €250 billion (2.2% of euro area GDP) in 2020, down from €280 billion (2.3% of GDP) in 2019
- : largest bilateral surpluses vis-à -visÌýUnited KingdomÌý(€151 billion) andÌýUnited StatesÌý(€79 billion), with largest deficits vis-à -visÌýoffshore centresÌý(€94 billion) andÌýChinaÌý(€79 billion)
- Ìýshowed net assets of €91 billion (around 0.8% of euro area GDP) at end of 2020
Current account
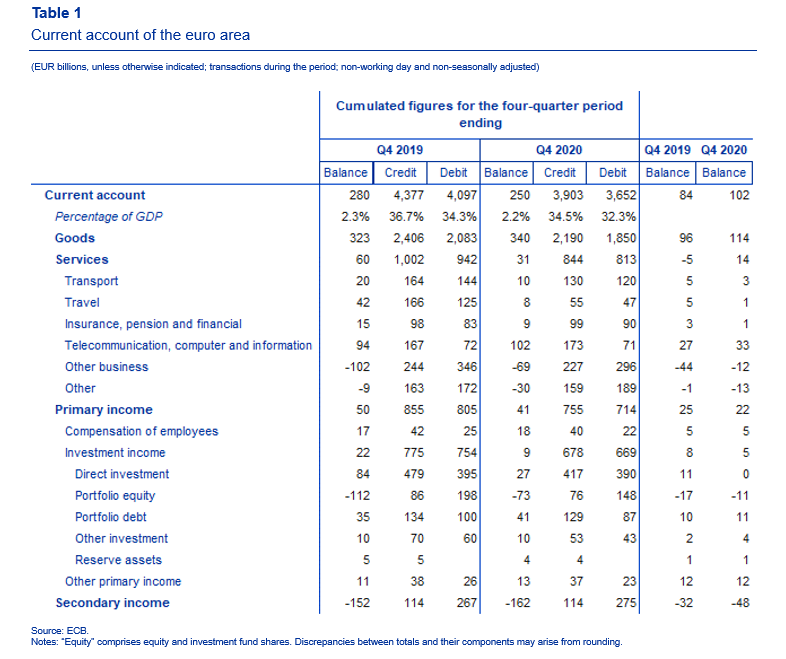
°Õ³ó±ðÌýcurrent accountÌýsurplus of theÌýeuro area declined to €250 billion (2.2% of euro area GDP) in 2020, from €280 billion (2.3% of GDP) in 2019 (see TableÌý1). This decrease reflected a reduction in the surpluses forÌýservicesÌý(from €60Ìýbillion to €31 billion) andÌýprimary incomeÌý(from €50Ìýbillion to €41Ìýbillion), and a larger deficit forÌýsecondary income, which increased from €152Ìýbillion to €162Ìýbillion.ÌýThese developments were partly offset by an increase in the surplus forÌýgoodsÌý(from €323Ìýbillion to €340Ìýbillion).
The smaller surplus forÌýservicesÌýwas mainly due to a decline in the surpluses forÌýtravel servicesÌý(from €42 billion to €8 billion) andÌýtransport servicesÌý(from €20 billion to €10 billion) and a larger deficit forÌýother servicesÌý(up from €9 billion to €30 billion). These developments were partly offset by a decline in the deficit forÌýother business servicesÌý(from €102 billion to €69 billion) and an increase in the surplus forÌýtelecommunication, computer and information servicesÌý(from €94 billion to €102Ìýbillion). The decrease in theÌýprimary incomeÌýsurplus was due to a fall in the surplus forÌýinvestment incomeÌý(from €22 billion to €9 billion). This reflected mainly a lower surplus forÌýdirect investment incomeÌý(down from €84 billion to €27 billion), which was partly offset by a smaller deficit forÌýportfolio equity incomeÌý(down from €112 billion to €73 billion) and a larger surplus forÌýportfolio debt incomeÌý(up from €35 billion to €41 billion).
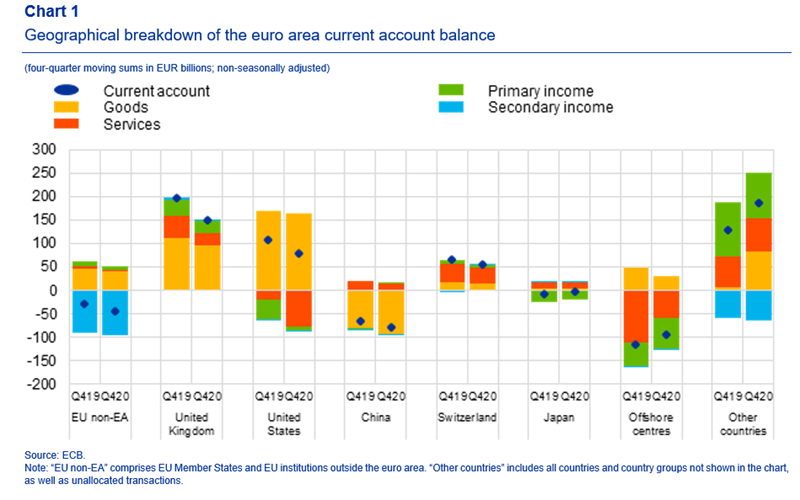
Data on the geographic counterparts of the euro area current account (see Chart 1) show that in 2020 the euro area recorded its largest bilateral surpluses vis-à -vis theÌýUnited KingdomÌý(€151 billion, down from €197 billion in 2019), theÌýUnited StatesÌý(€79 billion, down from €107 billion) andÌýSwitzerlandÌý(€54 billion, down from €65 billion). It also recorded a current account surplus vis-à -vis a residual group ofÌýother countriesÌý(€187 billion, up from €128 billion). The largest bilateral deficits were recorded vis-à -visÌýoffshore centresÌý(€94 billion, down from €115 billion) andÌýChinaÌý(€79 billion, up from €65 billion).
The most significant geographic changes in 2020 relative to 2019 were as follows. In theÌýgoodsÌýbalance there were decreases in the surpluses vis-à -visÌýoffshore centresÌý(from €48 billion to €30 billion) and theÌýUnited KingdomÌý(from €111 billion to €97 billion) and an increase in the deficit vis-à -visÌýChinaÌý(from €80 billion to €93 billion). Moreover, theÌýgoodsÌýsurplus vis-à -vis the residual group ofÌýother countriesÌýincreased strongly (from €7 billion to €82 billion), partly reflecting a decline in the deficit vis-à -visÌýRussiaÌý(from €33 billion to €4 billion).
InÌýservicesÌýthe deficit vis-à -vis theÌýUnited StatesÌýincreased (from €19 billion to €78 billion), while the deficit vis-à -visÌýoffshore centresÌýdeclined (from €111 billion to €58 billion). The surplus vis-à -vis theÌýUnited KingdomÌýdecreased (from €47 billion to €26 billion). InÌýprimary income,Ìýa lower deficit was recorded vis-à -vis theÌýUnited StatesÌý(down from €43 billion to €7 billion), while the deficit vis-à -visÌýoffshore centresÌýincreased (from €50 billion to €66 billion). InÌýsecondary income,Ìýthe deficit vis-à -vis theÌýEU Member States and EU institutions outside the euro areaÌýwidened slightly from €91 billion to €96 billion.
International investment position
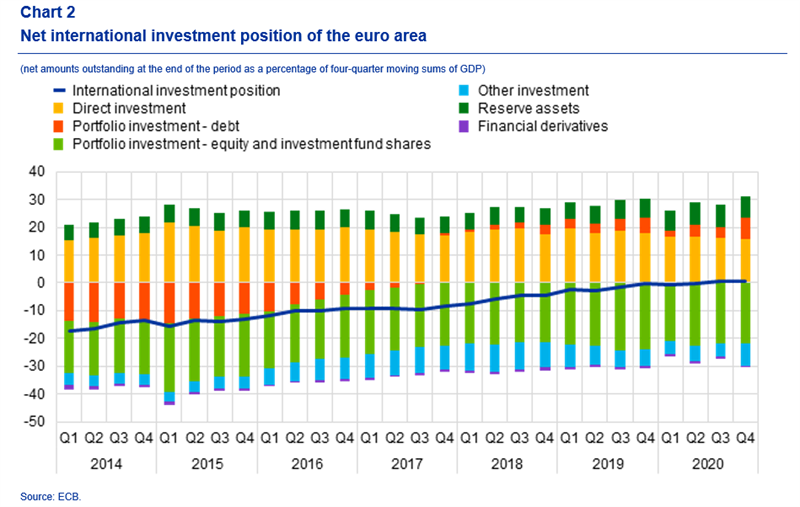
At the end of 2020 the international investment position of the euro area recorded net assets of €91 billion vis-à -vis the rest of the world (0.8% of euro area GDP), compared with net assets of €61 billion in the previous quarter (see ChartÌý2 and TableÌý2).
This improvement of €30 billion reflected large but partly offsetting changes in the various investment components. Larger net assets were recorded forÌýportfolio debtÌý(€885 billion, up from €435 billion), while net assets declined inÌýdirect investmentÌý(€1,773 billion, down from €1,848 billion). Larger net liabilities were recorded forÌýother investmentÌý(€874 billion, up from €568 billion) andÌýportfolio equityÌý(€2,486 billion, up from €2,467 billion).
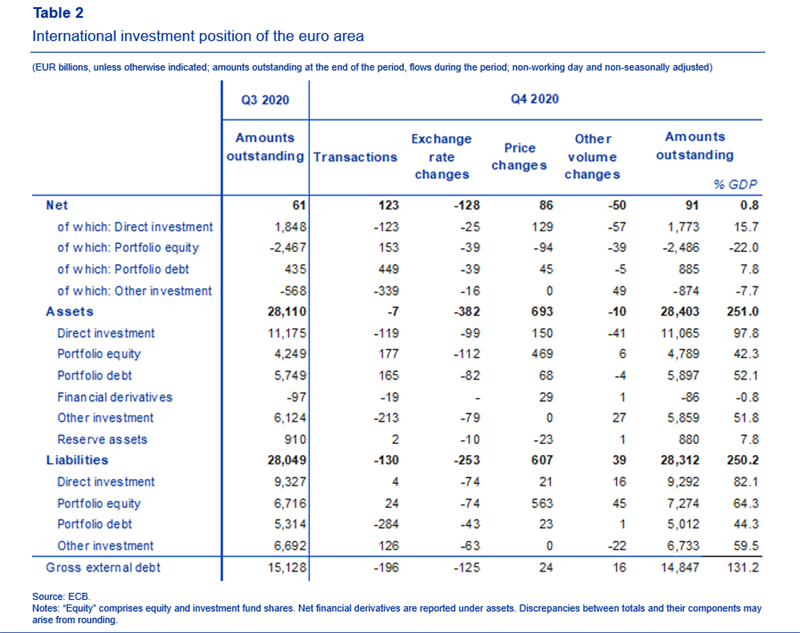
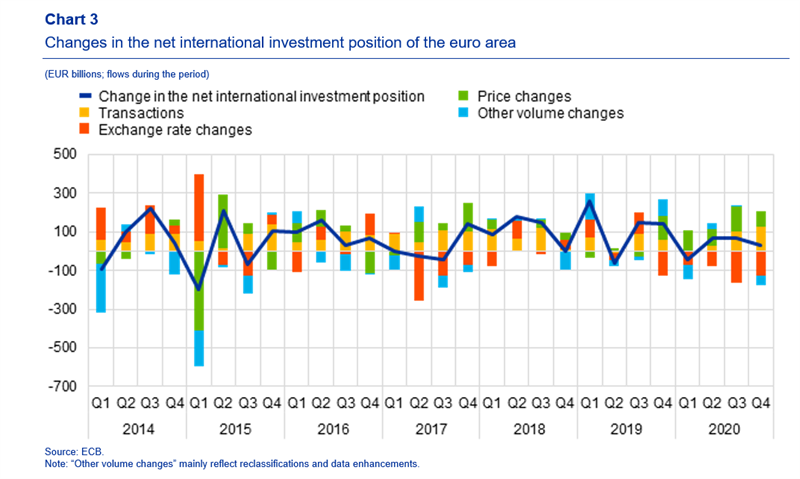
The change in the euro area’s net international investment position in the fourth quarter of 2020 was driven by positive net flows due to transactions and price changes, which were partly offset by negative net exchange rate changes and other volume changes (see Chart 3).
Both the increase in net assets forÌýportfolio debtÌýand the increase in net liabilities forÌýother investmentÌýwere largely driven by transactions (see Table 2). Larger net liabilities forÌýportfolio equityÌýresulted from a combination of negative net price changes, exchange rate changes and other volume changes, which were partly offset by positive transactions. TheÌýdecrease in net assets forÌýdirect investmentÌýwas due to negative net flows in transactions, other volume changes and exchange rate changes, which were partly offset by positive net price changes.
At the end of 2020 theÌýgross external debtÌýof the euro area amounted to €14.8 trillion (around 131% of euro area GDP), down by €281 billion compared with the previous quarter.
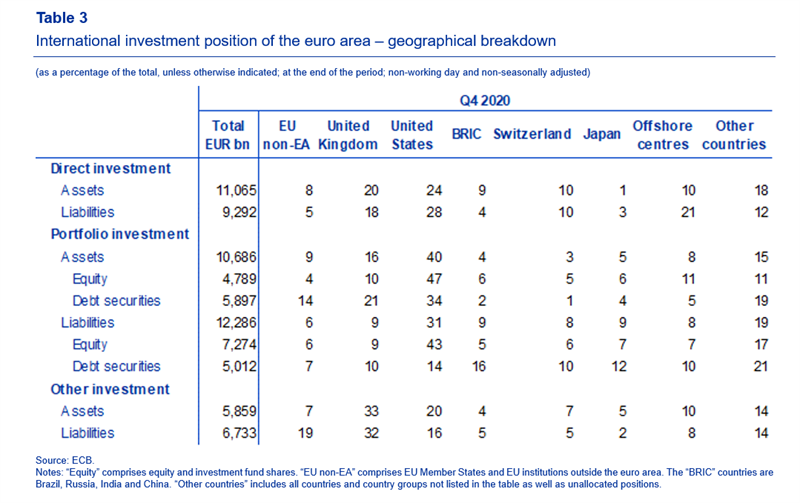
At the end of 2020 the stock of euro areaÌýdirect investment assetsÌýwas €11.1 trillion, 24% of which was invested in theÌýUnited StatesÌýand 20% in theÌýUnited KingdomÌý(see Table 3). The stock ofÌýforeign direct investment liabilitiesÌýwas €9.3 trillion, with 28% being investments by theÌýUnited States,Ìý21% byÌýoffshore centresÌýand 18% by theÌýUnited Kingdom.
InÌýportfolio investment, euro area holdings of foreign securities amounted to €4.8 trillion in equity and to €5.9 trillion in debt at the end of 2020. The largest holdings of equity securities by the euro area were from theÌýUnited StatesÌý(accounting for 47%), followed byÌýoffshore centresÌýandÌýtheÌýUnited KingdomÌý(11% and 10% respectively). For debt securities, the largest holdings by the euro area were from theÌýUnited StatesÌý(accounting for 34%), theÌýUnited KingdomÌý(21%) and theÌýEU Member States and EU institutions outside the euro areaÌý(14%). On theÌýportfolio investmentÌýliabilities side, non-residents’ holdings of securities issued by euro area residents stood at €7.3 trillion in equity and at €5.0 trillion in debt at the end of 2020. The largest holder countries of euro area equity securities were theÌýUnited StatesÌý(43%) and theÌýUnited KingdomÌý(9%), while for euro area debt securities the largest holders were theÌýBRICÌýgroup of countriesÌý(16%), theÌýUnited StatesÌý(14%) andÌýJapanÌý(12%).
InÌýother investment, euro area residents’ claims on non-residents amounted to €5.9 trillion, 33% of which was vis-à -vis theÌýUnited KingdomÌýand 20% vis-à -vis theÌýUnited States. Euro areaÌýother investmentÌýliabilities amounted to €6.7 trillion, with theÌýUnited KingdomÌýaccounting for 32%, while the shares of theÌýEU Member States and EU institutions outside the euro areaÌýand theÌýUnited StatesÌýwere 19% and 16% respectively.
ecb.europa.eu


