

- Ìýsurplus at €231 billion (2.0% of euro area GDP) in four quarters to third quarter of 2020, down from €265 billion a year earlier
- : largest bilateral surpluses vis-à -visÌýUnited KingdomÌý(€138 billion) andÌýUnited StatesÌý(€73 billion), withÌýlargest deficitsÌývis-à -visÌýoffshore centresÌý(€100 billion) andÌýChinaÌý(€79 billion)
- Ìýshowed net liabilities of €10 billion (around 0.1% of euro area GDP)Ìýat end of third quarter
Current account
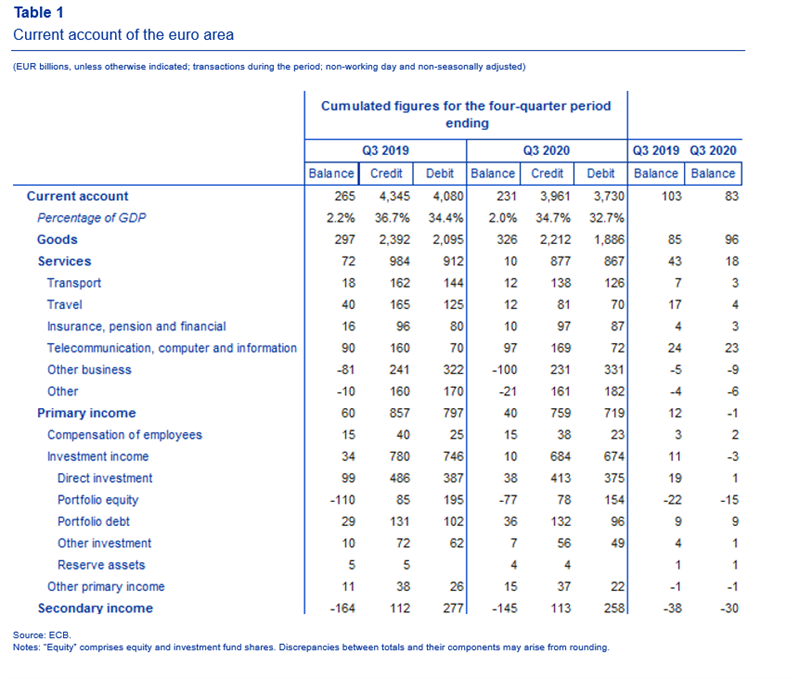
°Õ³ó±ðÌýcurrent accountÌýsurplus of theÌýeuro area declined to €231 billion (2.0% of euro area GDP) in the four quarters to the third quarter of 2020, from €265 billion a year earlier (see TableÌý1). This decrease reflected a reduction in the surpluses forÌýservicesÌý(from €72Ìýbillion to €10 billion) andÌýprimary incomeÌý(from €60Ìýbillion to €40Ìýbillion).ÌýThese developments were partly offset by an increase in the surplus forÌýgoodsÌý(from €297Ìýbillion to €326Ìýbillion) and a lower deficit forÌýsecondary incomeÌý(down from €164Ìýbillion to €145Ìýbillion).
The smaller surplus forÌýservicesÌýwas mainly due to a decline in the surplus forÌýtravelÌý(from €40 billion to €12 billion) and increases in the deficit forÌýother business servicesÌý(from €81 billion to €100 billion) and forÌýother servicesÌý(from €10 billion to €21 billion). These developments were only partially offset by an increase in the surplus forÌýtelecommunication, computer and information servicesÌý(from €90 billion to €97Ìýbillion).
The decrease in theÌýprimary incomeÌýsurplus was due to a fall in the surplus forÌýinvestment incomeÌý(from €34 billion to €10 billion). This reflected mainly a lower surplus forÌýdirect investment incomeÌý(down from €99 billion to €38 billion), which was partly offset by a smaller deficit forÌýportfolio equity incomeÌý(down from €110 billion to €77 billion) and a larger surplus forÌýportfolio debt incomeÌý(up from €29 billion to €36 billion).
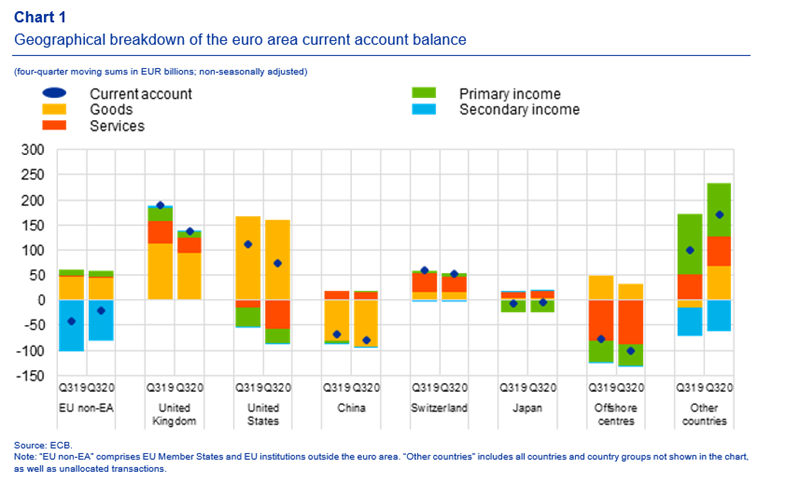
Data on the geographic counterparts of the euro area current account (see Chart 1) show that in the four quarters to the third quarter of 2020 the euro area recorded its largest bilateral surpluses vis-à -vis theÌýUnited KingdomÌý(€138 billion, down from €189 billion a year earlier), theÌýUnited StatesÌý(€73 billion, down from €111 billion) andÌýSwitzerlandÌý(€53 billion, down from €59 billion). It also recorded a current account surplus vis-à -vis a residual group ofÌýother countriesÌý(€172 billion, up from €100 billion). The largest bilateral deficits were recorded vis-à -visÌýoffshore centresÌý(€100 billion, up from €77 billion) andÌýChinaÌý(€79 billion, up from €69 billion).
The most significant geographic changes in the four quarters to the third quarter of 2020 relative to the previous year were as follows. In theÌýgoodsÌýbalance there were decreases in the surpluses vis-à -vis theÌýUnited KingdomÌý(from €113 billion to €95 billion) andÌýoffshore centresÌý(from €49 billion to €31 billion), an increase in the deficit vis-à -visÌýChinaÌý(from €82 billion to €92 billion), and a shift from a deficit of €14 billion to a surplus of €68 billion vis-à -vis the residual group ofÌýother countries, partly reflecting a decline in the deficit vis-à -visÌýRussiaÌý(from €39 billion to €10 billion). InÌýservices,Ìýthe deficit vis-à -vis theÌýUnited StatesÌýincreased (from €15 billion to €58 billion) and the surplus vis-à -vis the United Kingdom decreased (from €45 billion to €31 billion). Moreover, inÌýprimary incomeÌýsurpluses decreased vis-à -vis theÌýUnited KingdomÌý(from €27 billion to €11 billion) and vis-à -vis the residual group of other countries (from €120 billion to €106 billion) were recorded, while theÌýsecondary incomeÌýdeficit vis-à -vis theÌýEU Member States and EU institutions outside the euro areaÌýdeclined from €103 billion to €80 billion.
International investment position
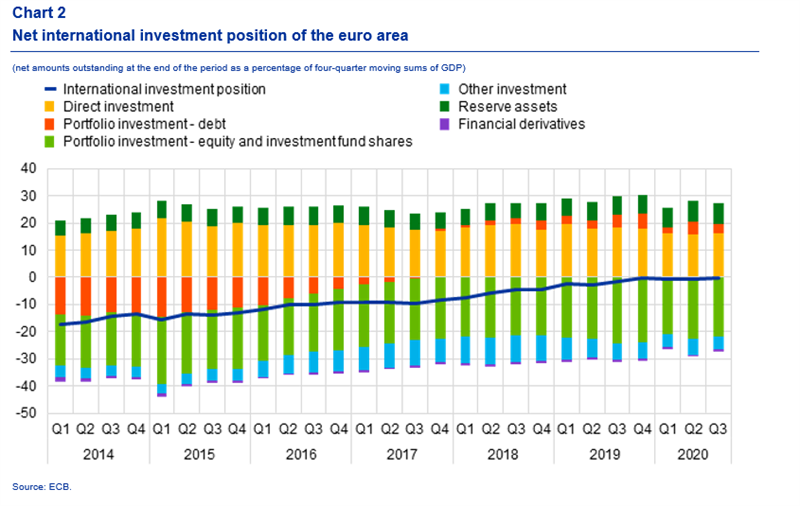
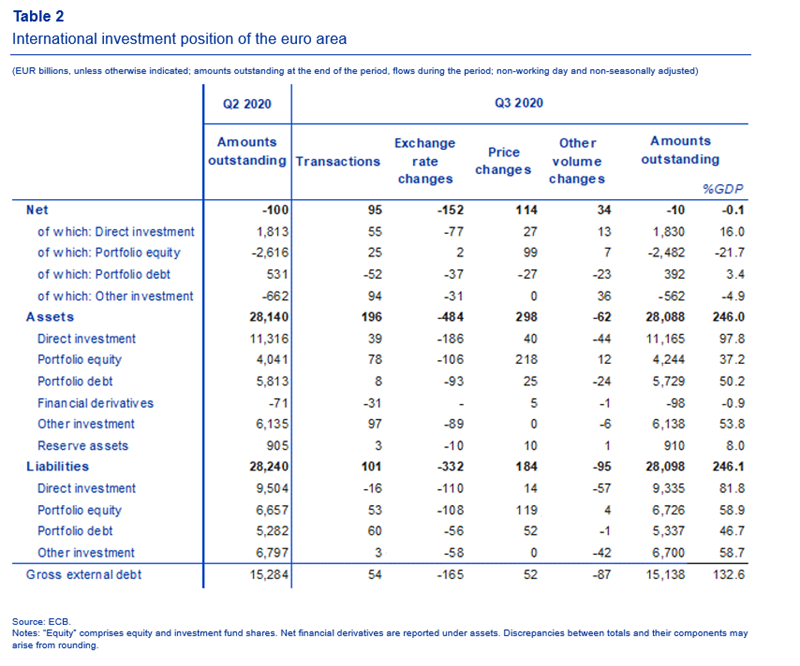
At the end of the third quarter of 2020 the international investment position of the euro area recorded net liabilities of €10 billion vis-à -vis the rest of the world (0.1% of euro area GDP), compared with net liabilities of €100 billion in the previous quarter (see ChartÌý2 and TableÌý2).
This improvement of €90 billion reflected large but partly offsetting changes in the various investment components. Smaller net liabilities were recorded forÌýportfolio equityÌý(€2,482 billion, down from €2,616 billion) andÌýother investmentÌý(€562 billion, down from €662 billion), while net assets increased inÌýdirect investmentÌý(€1,830 billion, up from €1,813 billion) and decreased forÌýportfolio debtÌý(€392 billion, down from €531 billion).
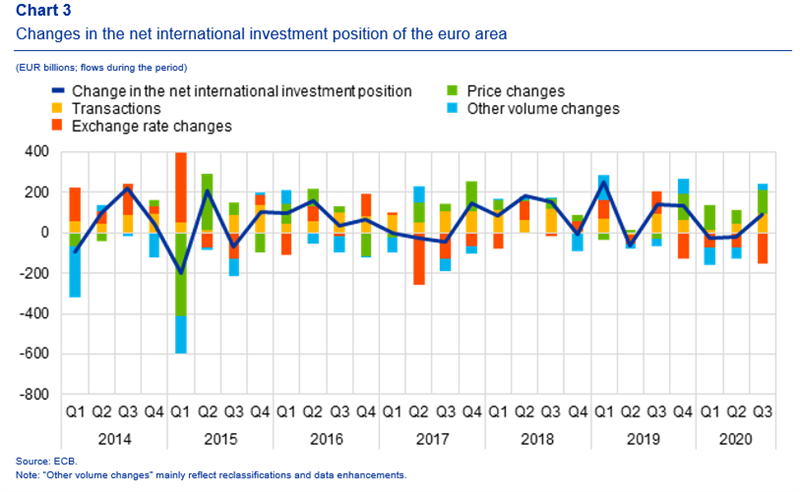
The change in the euro area’s net international investment position in the third quarter of 2020 was driven by positive net flows due to price changes, transactions and other volume changes, which were partially compensated by negative net exchange rate changes (see Chart 3).
The increase in net assets forÌýdirect investmentÌýwas mainly due to transactions and positive net price changes, partially compensated by negative net exchange rate changes (see Table 2). Lower net liabilities forÌýportfolio equityÌýresulted mainly from positive net price changes and transactions, while lower net liabilities forÌýother investmentÌýwere mainly driven by transactions. TheÌýdecrease in net assets forÌýportfolio debtÌýwas due to negative net flows in transactions, price changes, exchange rate changes and other volume changes (see Table 2).
At the end of the third quarter of 2020 theÌýgross external debtÌýof the euro area amounted to €15.1 trillion (around 133% of euro area GDP), down by €145 billion compared with the previous quarter.
Data revisions
This statistical release incorporates revisions to data for the reference periods between the first quarter of 2017 and the second quarter of 2020. The revisions reflect revised national contributions to the euro area aggregates as a result of the incorporation of newly available information and do not significantly alter the figures previously published.
Next releases
- Monthly balance of payments: 19 January 2021 (reference data up to November 2020)
- Quarterly balance of payments and international investment position: 9 April 2021 (reference data up to the fourth quarter of 2020)
ecb.europa.eu


