

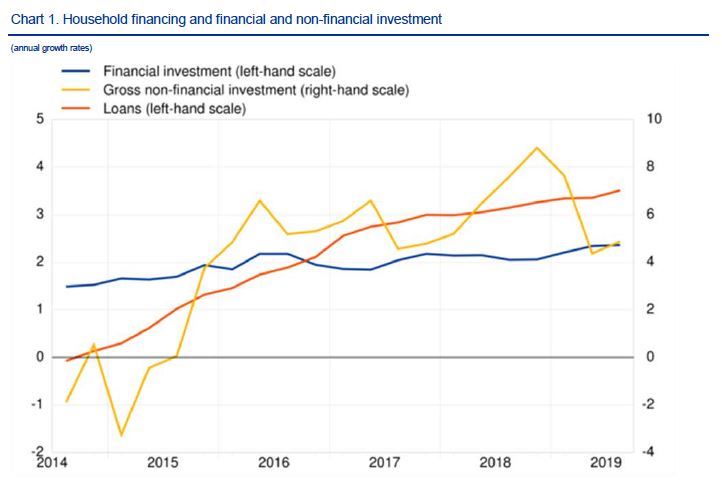
The annual growth rate ofÌýÌýto households stood at 3.5% in the third quarter of 2019, after 3.4% in the previous quarter. TheÌýÌýof households increased at a broadly unchanged rate of 2.4% and theirÌýÌýincreased at a higher rate of 4.9% (after 4.4%), while theirÌýÌýincreased at a higher rate of 5.3% (after 4.3%).
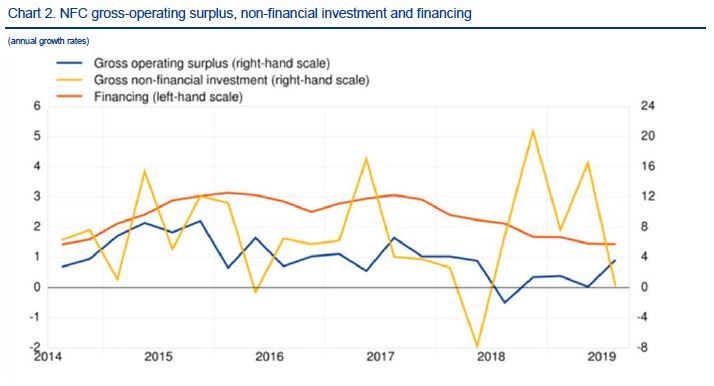
The annual growth rate of theÌýÌýof non-financial corporations (NFCs) was 3.7% in the third quarter of 2019, higher than in the previous quarter (0.1%).Ìýincreased at a higher rate of 2.5% (after 1.6%). The annual growth rate of NFCs’ÌýÌýdecreased to 0.1% (from 16.6%, which mainly reflected the import of intellectual property products), while theirÌýÌýincreased at a broadly unchanged rate of 1.4%.
Households
The annual growth rate of householdÌýÌýincreased in the third quarter of 2019 at an unchanged rate of 3.5% as compared with the previous quarter. Similarly, gross operating surplus and mixed income of the self-employed increased at an unchanged rate of 3.1%, while compensation of employees grew at a lower rate of 3.5% (after 3.7%). Household consumption expenditure increased at an unchanged rate of 2.5%.
The householdÌýÌýin the third quarter of 2019 was 13.0%, compared with 12.8% in the previous quarter.
The annual growth rate of householdÌýÌý(which refers mainly to housing) increased to 4.9% in the third quarter of 2019, from 4.4% in the previous quarter. The annual growth rate of lÌýto households, the main component of household financing, stood at 3.5% (after 3.4%).
The annual growth rate of householdÌýÌýstood at a broadly unchanged rate of 2.4% in the third quarter of 2019. Among its components, currency and deposits grew at a higher rate of 5.3% (after 4.9%), and investment in life insurance and pension schemes grew also at a higher rate of 2.8% (after 2.3%). Conversely, investment in shares and other equity decreased at a slightly higher rate of -0.4% (after -0.1%), and investment in debt securities further declined at a higher rate of -8.0% (after -3.4%).
The annual growth rate of householdÌýÌýincreased to 5.3% in the third quarter of 2019, from 4.3% in the previous quarter, mainly driven by higher valuation gains in financial assets. The householdÌýÌýstayed broadly unchanged at 93.6% in the third quarter of 2019 as compared with the third quarter of 2018, as disposable income grew at broadly the same pace as loans to households.
Non-financial corporations
Ìýby NFCs increased at a higher rate of 3.9% (after 3.0%) in the third quarter of 2019.ÌýÌýincreased to 3.7% year-on-year, from 0.1% in the previous quarter, and net property income (defined in this context as property income receivable minus interest and rent payable) decreased. As a resultÌýÌý(broadly equivalent to cash flow) increased at a higher rate of 2.5% (after 1.6%).Ìý[1]
The annual growth rate of NFCÌýÌýdecreased to 0.1% (from 16.6%, which mainly reflected the import of intellectual property products).Ìý[2]ÌýÌýof NFCs increased at a broadly unchanged rate of 1.4%, as the increase in the annual growth rate of issuance of debt securities and equity by NFCs as compared with the previous quarter was compensated by a decrease in the growth rate of loan financing.
NFCs’ debt-to-GDP ratio (new consolidated measure) increased to 78.1% in the third quarter of 2019, from 77.6% in the third quarter of 2018; the non-consolidated, wider debt measure decreased to 140.0%, from 140.4%.
NFCÌýÌýgrew at a broadly unchanged annual rate of 1.8%. Among its components, increases in the growth rate of currency and deposits, and of shares and other equity, as well as a lower disinvestment on debt securities were compensated by a reduction in the growth rate of loans granted.
[1]ÌýGross entrepreneurial income is the sum of gross operating surplus and property income receivable minus interest and rent payable.
[2]ÌýGross non-financial investment is the sum of gross fixed capital formation, changes of inventories, and the net acquisition of valuables and non-produced assets (e.g. licences).
ecb.europa.eu
pixabay.com


