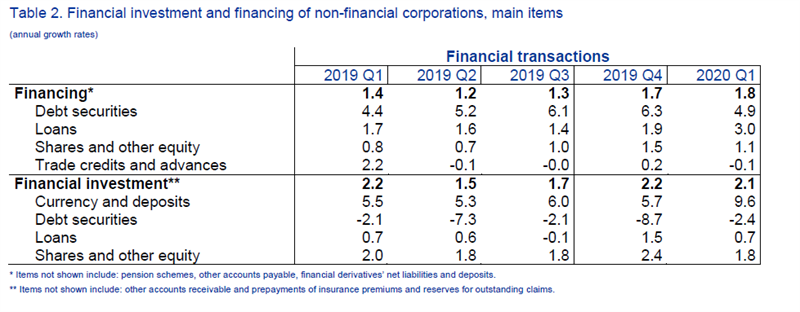
Euro area decreased to €832 billion in the four quarters to the first quarter of 2020, compared with €871 billion in the four quarters to the previous quarter. Euro area decreased to €573 billion (from €584 billion previously), due to decreased investments by households and non-financial corporations. Euro area to the rest of the world decreased to €267 billion (from €295 billion previously) reflecting the decrease in net saving (see Chart 1).
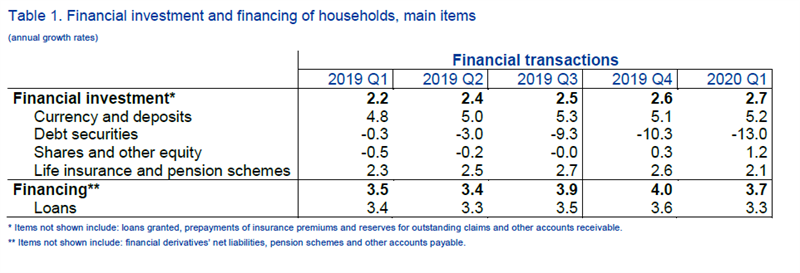
The household increased to 93.6% in the first quarter of 2020 compared with 93.3% in the first quarter of 2019. Non-financial corporations’ (consolidated measure) increased to 79.0% in the first quarter of 2020, from 77.5% in the first quarter of 2019; the , wider debt measure increased to 139.4% from 138.5% (see Chart 2).
Total euro area economy
Euro area decreased to €832 billion (8.6% of euro area net disposable income) in the four quarters to the first quarter of 2020 compared with €871 billion in the four quarters to the previous quarter. Euro area decreased slightly to €573 billion (5.9% of net disposable income), from €584 billion previously, due to decreased investments by households and non-financial corporations, while net investments by financial corporations and government were unchanged.Euro area to the rest of the world decreased to €267 billion in the four quarters to the first quarter of 2020 (from €295 billion in the four quarters to the previous quarter) reflecting the decrease in net saving, which was only partly offset by lower net non-financial investment. Net borrowing by non-financial corporations increased to €72 billion (-0.7% of net disposable income) from €15 billion, while the net lending by financial corporations increased to €90 billion (0.9% of net disposable income) from €87 billion. Net lending by households increased to €373 billion (3.9% of net disposable income) from €299 billion. The overall increase in net lending by the total private sector was more than offset by an increase in net borrowing of the government sector (to €124 billion from €76 billion, that is to -1.3% of net disposable income, after -0.8% previously).
Calculated as loans divided by gross disposable income adjusted for the change in pension entitlements.
Households
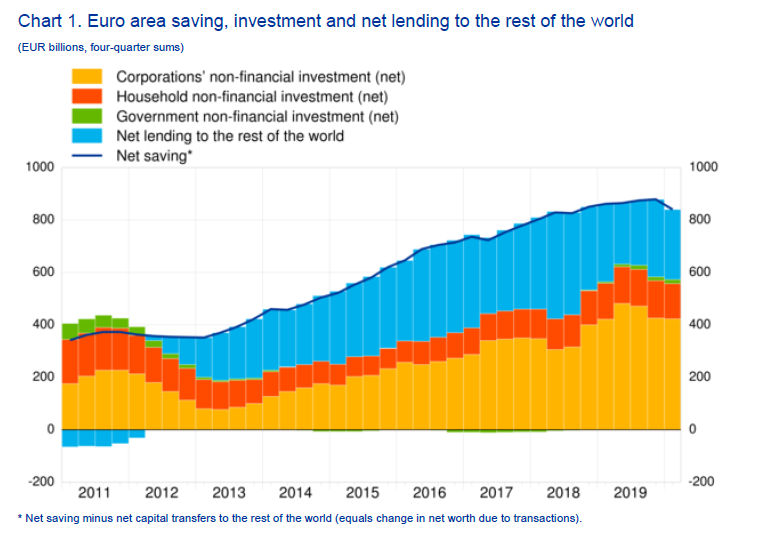
The annual growth rate of household stood at a broadly unchanged rate of 2.7% in the first quarter of 2020. Stronger investment in shares and other equity as well as in currency and deposits was offset by larger disinvestment from debt securities and a slower growth in life insurance and pension schemes.
Households were overall net buyers of listed shares, mainly those issued by other financial institutions and the rest of the world sector (i.e. shares issued by non-residents). Households continued to sell debt securities (in net terms, and including redemptions). These net sales involved mainly debt securities issued by euro area MFIs and general government (see Table 1 below and ).The household increased to 93.6% in the first quarter of 2020 from 93.3% in the first quarter of 2019, as the outstanding amount of loans to households grew faster than disposable income. Similarly the household increased, to 58.2% in the first quarter of 2020 from 57.5% in the first quarter of 2019 (see Chart 2).
Calculated as loans divided by gross disposable income adjusted for the change in pension entitlements.
Non-financial corporations
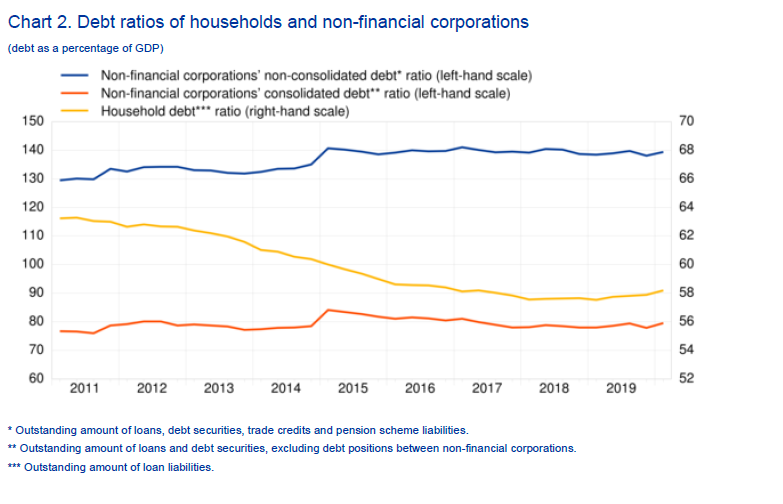
In the first quarter of 2020 the annual growth of of non-financial corporations stood at 1.8%, a broadly unchanged rate compared with the previous quarter. This resulted from an acceleration in the growth of loans from all resident sectors, which offset a deceleration in financing in the form of debt securities and equity, and a reduction of trade credits (see Table 2 below and ).Non-financial corporations’ (consolidated measure) increased to 79.0% in the first quarter of 2020, from 77.5% in the first quarter of 2019, as the debt grew faster than GDP. The , wider debt measure increased to 139.4% from 138.5% (see Chart 2).